Understanding Mood Insights in the PULT App
The PULT App features a tool called "Mood Survey" that gauges the mood and engagement of employees within a team.
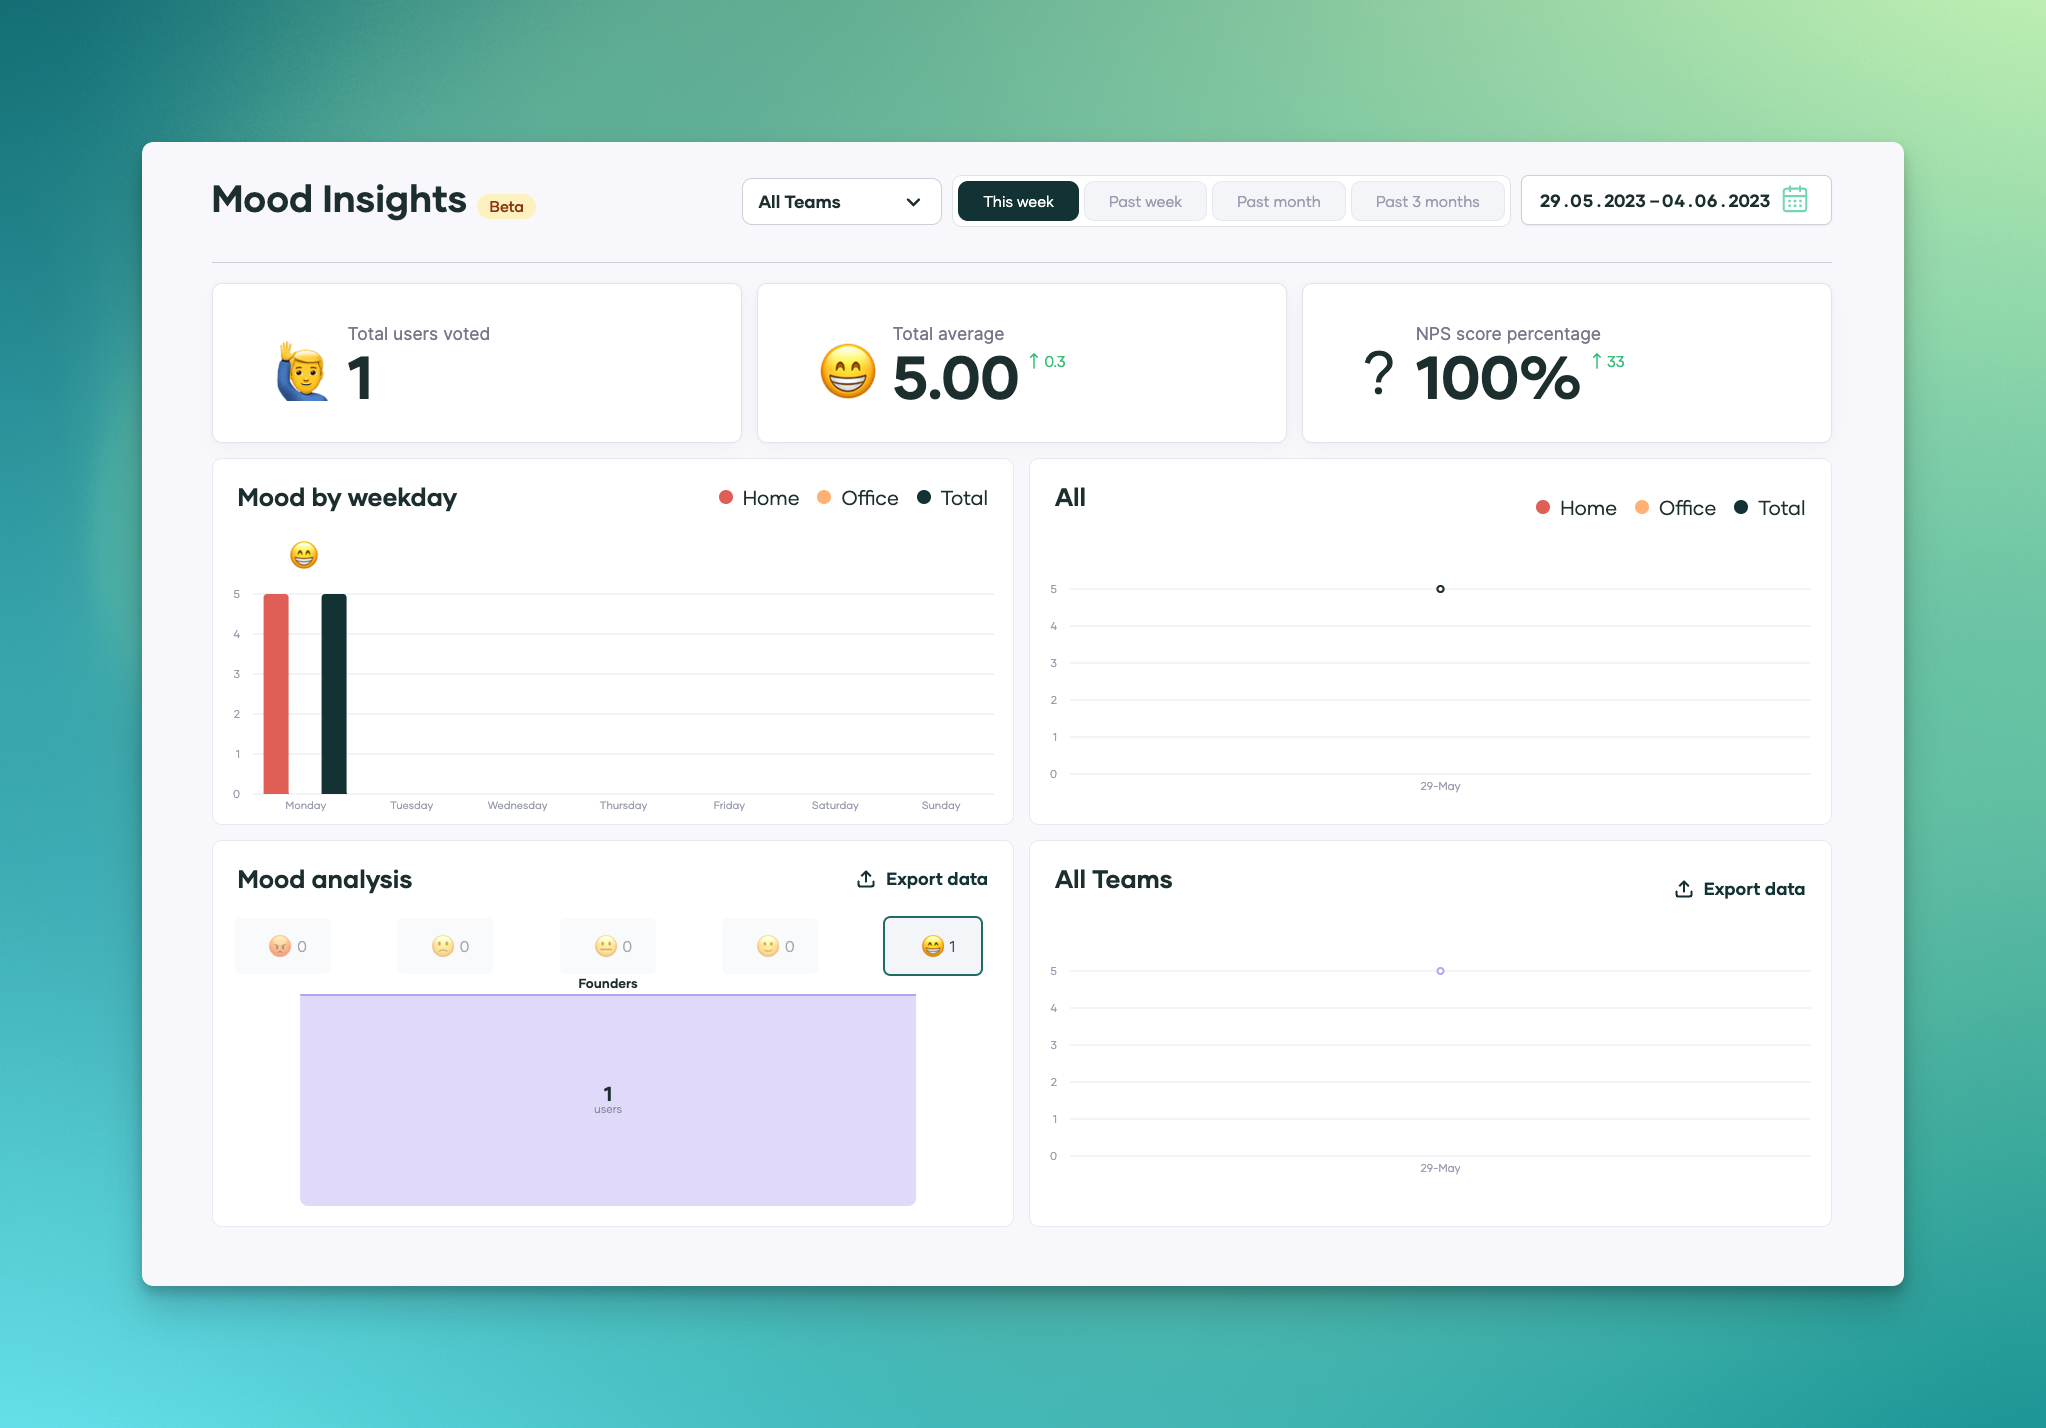
This data is presented on the dashboard, under Insights, providing an insight into the overall work atmosphere.

Time Span
At the top of the dashboard, you can choose between different time spans:
-
"This week"
-
"Past week",
-
"Past month"
-
"Past 3 months".
This helps you analyze the mood over different periods and recognize trends or changes over time.
Total Users Voted
This number shows how many users participated in the mood surveys during the selected time span.
High participation in these surveys indicates high engagement and interest from employees in their workplace and role.
Total Average
This is the average value of the mood ratings that the employees have given. The ratings range from 😡 (very dissatisfied) to 😁 (very satisfied).
A high average indicates a generally positive work atmosphere.
NPS Score Percentage
NPS stands for Net Promoter Score, a measure of employees' willingness to recommend their company.
A high NPS percentage suggests high employee satisfaction and loyalty.
Mood by Weekday and Mood by Date
These sections show the average mood ratings by weekdays and by date.
Here you can look for patterns to see if certain days or dates are associated with a higher or lower mood.
Mood Analysis
This section shows the distribution of the various mood ratings from 😡 to 😁. A balanced ratio shows a mixed mood, while a dominance of a certain mood indicates a general mood within the team.
Export Data
With this feature, you can download all Mood Insights data for more detailed analysis.
Mood Insights is a powerful tool for improving the work atmosphere and employee satisfaction.
By continuously observing and analyzing this data, you can identify patterns and trends, and take proactive steps to improve the working environment.
Please note that this feature is currently still in the beta phase and is continuously being developed to enhance user experience.
