How to use "Scheduled Reports"
Last updated: February 20, 2026
Setting Up Weekly and Monthly Reports
You can configure automated presence reports using the AI Assistant's reporting feature:
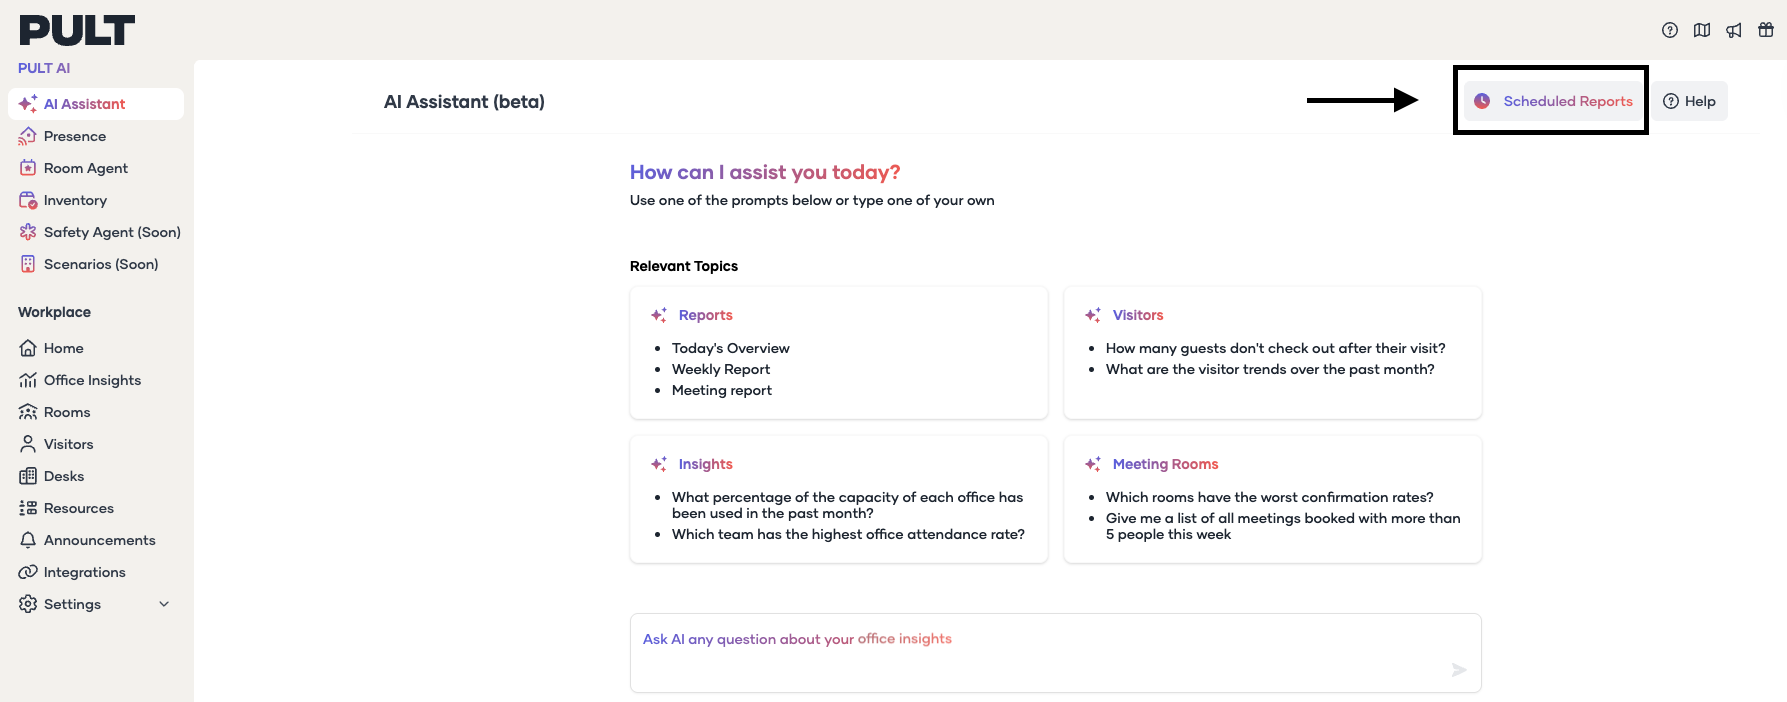
Go to the AI Assistant and click on Scheduled Reports in the top-right corner
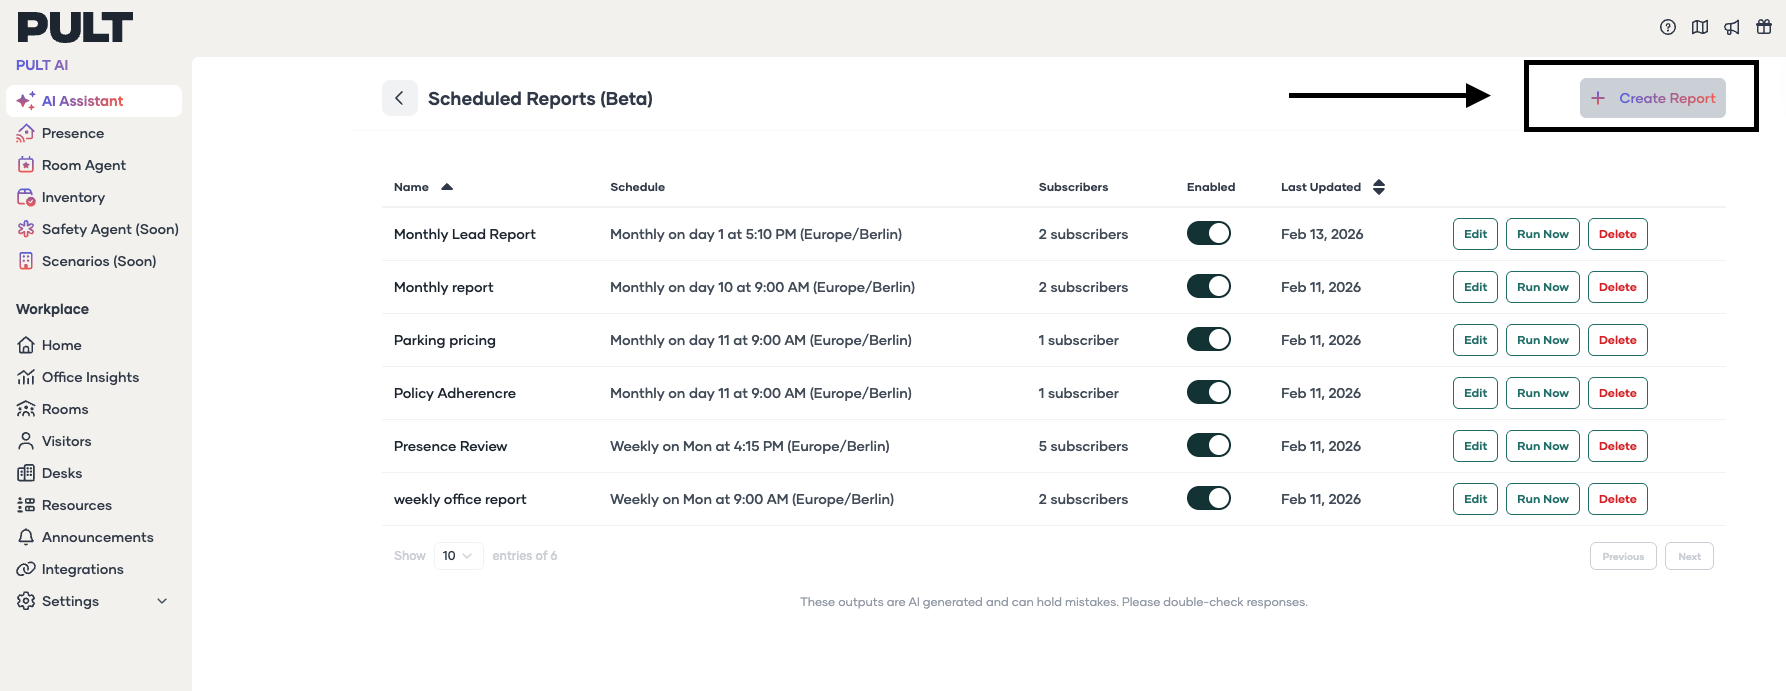
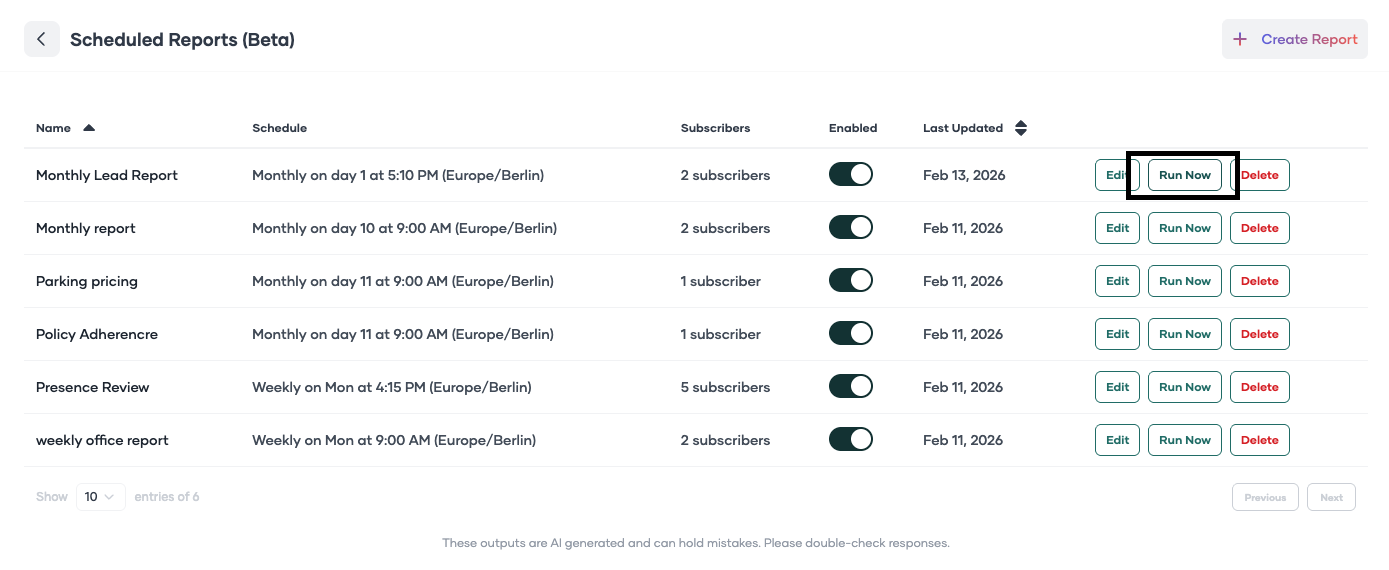
Click Create Report
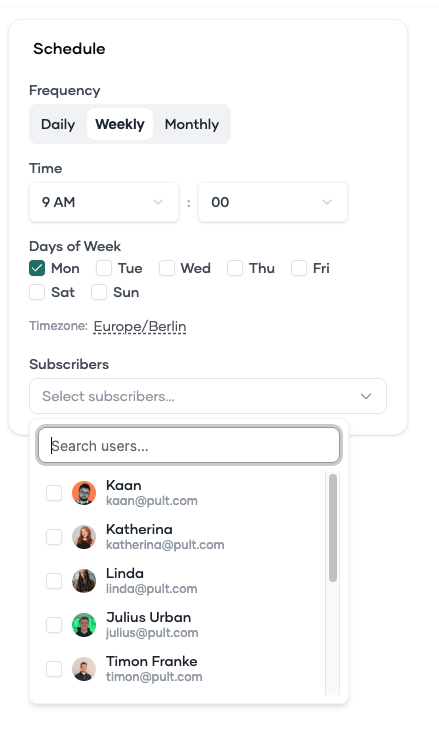
Define the frequency, weekday, time, and recipients
Write your prompt with detailed specifications
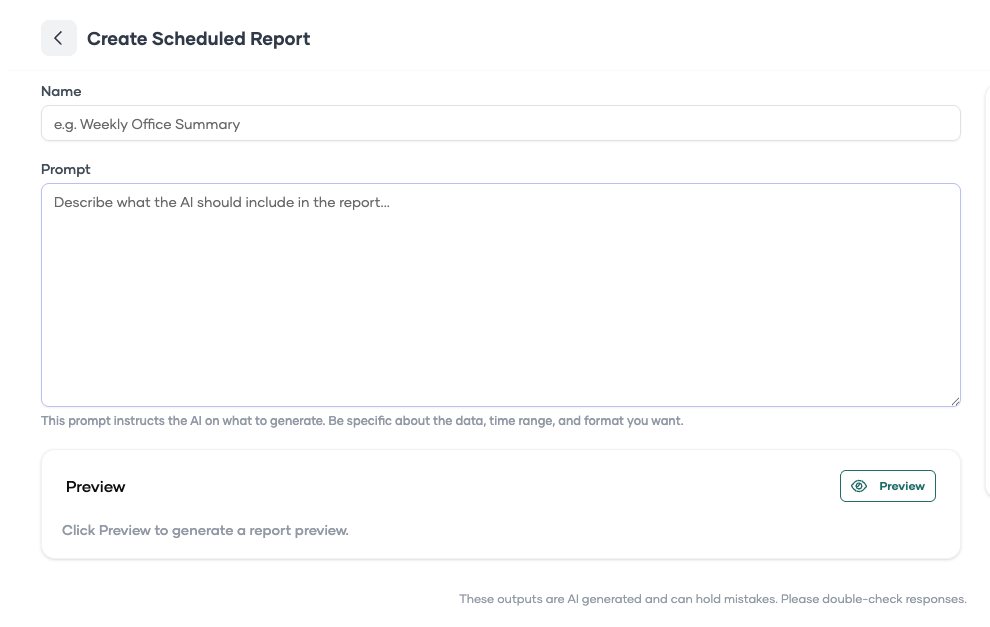
Click Schedule
Use Run Now to test the report immediately
Sample Report Prompts
Monthly Report Prompt:
Please generate a monthly report for all the users in which you list the following data: E-mail address + Sum of Days detected by Pult Presence from the first day of the past month until the last day of the past month + Sum of days booked in business_trip + Sum of days booked in home office + Sum of days booked in remote + Sum of days booked in sick + Sum of days booked in vacation. Please also highlight all users that have 0 or 1 Presence Days.
Weekly Report Prompt:
Please generate a report from last week for all the users in which you list the following data: E-mail address + Sum of Days detected by Pult Presence from the Monday last week until Friday last week + Sum of days booked in business_trip + Sum of days booked in home office + Sum of days booked in remote + Sum of days booked in sick + Sum of days booked in vacation. Please also highlight all users that have 0 or 1 Presence Days.
Customizing Reports
You can edit existing reports or create new ones by modifying the prompts to include specific criteria, such as:
Filtering for employees with low presence
Cross-referencing with holiday data
Highlighting policy compliance issues
After creating a report, allow the system a few minutes to process. You can always click Edit to make adjustments to your reports as needed.
Currently, reports are sent via email: While PDF and Excel downloads are not directly available, you can:
For PDF: Open the email report and use your browser's print function, then save as PDF
For Excel: Select the data table from the email report and copy-paste it into a spreadsheet application where you can add filters and manipulate the data